Posts

Showing posts from May, 2025

Types of problem suited to big data analysis. (6)

Image
  Optimization Problems Optimization problems are essentially about getting the best solution from a large number of options, usually within some constraints. For example, delivery firms employ big data to design the most effective routes for their drivers, which not only saves time but also fuel. In a similar way, factories are fine-tuning their production schedules to produce the highest output at the lowest possible cost and downtime. Big data aids in this by utilizing the massive data and running various scenarios to pick the best one. This, in turn, results in more efficient resource use, cost reduction, and enhanced service quality in different industries.

Types of problem suited to big data analysis. (5)

Image
  Recommendation Problems Recommendation systems are application areas that aim to solve the problem of finding good items under certain constraints. These systems target offering a list of top N items that meet user preferences. The examples are Netflix, an online streaming service, which studies the users' behavior, that is, what shows people watch, and then decides on the movies similar to those that the users might like. In turn, Amazon is an online retailer that uses the data about the users' browsing and purchasing history to recommend products that fit the customers the best. Big data allows recommendations to be more precise and individualized by analyzing the behavior of millions of users simultaneously. This is how the companies can satisfy their customers, get more sales, and keep users engaged by always showing the most relevant content to them.

Types of problem suited to big data analysis. (4)

Image
  Anomaly Detection Problems Anomaly detection is about looking for things that may be out of place or unexpected in the data, which don't resemble the standard pattern. To illustrate, banks apply big data in fraud detection; if a fraudulent transaction occurs, it will usually be a sudden big purchase in a foreign country, for instance. Equally, factories, watch over their equipment to be sure that there are no unusual vibrations or temperatures that can be the indication of a problem before it gets to the point of breaking down. Diagnosing anomalies is significant as they are often the rare events that serve to reveal errors, fraud, or issues of safety. Big data, on the other hand, aid in this matter by very quickly going through an enormous amount of information and identifying the irregular spots so that the businesses can be in a position to solve the problem immediately and not let it get worse.

Types of problem suited to big data analysis. (3)

Image
  Clustering Problems Clustering problems have to do with partitioning the data into groups of similar data points without using any predefined categories. For instance, a retailer might want to classify customers based on their shopping habits to get to know different types of buyers better. A large-scale data analysis identifies inherent clusters or groups in the data, thus uncovering hidden patterns that were not visible before. This kind of problem enables the businesses to customize their marketing campaigns, suggest the right products, or even make the customer service better by recognizing the groups which have different preferences. Clustering is one of the most commonly used techniques in the research of the market, social network analysis, and image recognition.

Types of problem suited to big data analysis. (2)

Image
  Classification Problems Classification problems are those where data are distributed in different groups or categories. For example, in mail, the classification can be as spam or not spam. Data analytics software evaluates the message itself, the author, and several other conditions to take the right decisions. To provide an alternative illustration, the banks identify transactions as either fake or real to act against hackers. The purpose is to make the process of distinguishing more automatic and to raise the level of productivity. With the help of big data, companies can process a vast amount of data in a short time, keeping their systems up and running, and ensuring that the users are not affected by unwanted behaviors and viruses. One of the primary goals of Classification is to demonstrate and exemplify how the Decision-making process can be automated, and hence lead to greater productivity. As such, by utilizing pop data instead, the organization can manage millions of cas...

Types of problem suited to big data analysis. (1)

Image
  Predictive Problems Predictive problems are the ones that are used to figure out the reasonable future based on historical data. For instance, a company may want to know who is more likely to buy their product or which machines are more likely to break down in a short time. The use of big data in analyzing the data helps in identifying the patterns of the historical data that can be used to predict the future. The above mentioned statement is important because it lets the businesses analyze the future in advance and be able to do such things as offering discounts to those customers, who are likely to leave, or identify the machines that might fail this is to say the company can improve its foresight and act in advance. On the other hand, the data that is too big for the human brain to process can be used and thus, many process mistakes will be avoided and a lot of patterns and trends will be noticed that lead to improvements. These problems are general in several areas such as: e...

Growth Of Data (including Measure Of data)

Image
  Growth Of Data (including Measure Of data) In the digital age we live in, data has been growing at an absurdly fast rate – to the extent that data is now measured in zettabytes and the industry estimates that we will have generated more than 180 zettabytes of data annually by 2025. One of the drivers of this rapid data growth is technology ranging from smartphones and streaming services to artificial intelligence and internet of things gadgets. On the other hand, due to the explosion in data volume, it's necessary to know how to measure it, not only in terms of quantity, but also in quality and the potential it carries with it. Basically, data is represented by a set of units since the lowest one, bytes (8 bits) and we then have kilobytes (KB), megabytes (MB), gigabytes (GB) and so on up to terabytes (TB), petabytes (PB), and finally zettabytes (ZB) and yottabytes (YB). Apart from just the size, current data metrics contain five other aspects such as the 5 Vs of big data which ar...

Underfitting & Overfitting - Explained In Video

Image
Underfitting & Overfitting The clip offers a quick look at the main problems in training of machine learning models: underfitting and overfitting. It introduces the aim of machine learning—building a model from data to be able to make correct predictions, and then using this model on new data. A model is underfitting if it is too simple or if it has not been trained properly, which means it cannot find significant patterns in the data and thus will be unable to make good predictions. A more suitable model may be chosen, training may be prolonged, or more training data may be used as solutions. Overfitting occurs in the opposite case, that is where a model is too complex and it “remembers” not only the training data, but also the noise and it mistakes information for which it cannot generalize, so its performance on new data will be poor. The movie also gives hints on how to spot overfitting based on comparing a model’s performance with training data and validation data, hence, reve...

Implications of big data for individuals (6)

Image
  Behavioural Influence Big data cannot only reflect behavior—it can also change it. Algorithms decide what people get to see online, it can be the news, or social media posts that have some particular aspect emphasized thus changing opinions and even emotions. This influence of changing behavior can be done in a good way if we talk about, for example, the induction of the health promoting habits or the society participation, but still, it can be misused. One of the ways big data has been employed in politics is to segment voters and provide them with personalized content, which however can be misinformation and sentiment manipulation. A scandal that clearly shows how data can be turned into a weapon to influence public opinion and elections without the full understanding or consent of the users is the 2016 Cambridge Analytica case. Social networking sites that are powered by engagement metrics often prioritize emotionally charged content. As a result, this can be a perfect settin...

Implications of big data for individuals (5)

Image
  Bias and Discrimination Big data systems, which appear to be objective, are in reality capable of perpetuating bias and even extending it. Algorithms that are trained on old data can become like society prejudices and, consequently, unfairness can be the result in areas like hiring, lending, policing, and healthcare. For instance, a hiring algorithm that uses we can past hiring that reflect racial or gender biases may discriminate against certain groups without being aware of it. On the other hand, one huge issue with the present situation is the lack of openness in the operations of algorithms. People do not understand why they were refused a loan or that they were not chosen for a job and because of this, they cannot find and challenge biased decisions. This goal of accountability is jeopardized due to this opacity, along with the difficulties in detecting and correcting discrimination. Similar to these points is the fact that biased algorithms may impact marginalized groups i...

Implications of big data for individuals (4)

Image
  Economic Opportunities and Challenges For data scientists, machine learning experts, and analytics, big data has formed a whole new economy. Experts with proper technical skills are sought after, earning good salaries, and they are the ones who are changing the face of the future of industries that extend from marketing to finance. This stands as a great economic opportunity for the people who have access to education and training. On the other hand, the data economy causes the automation and displacement of the jobs too. The majority of traditional jobs are being gotten rid of by the AI systems that are based on big data, especially those in the fields of retail, logistics, and customer service. It generates economic uncertainty in particular for the workers, whose roles are most vulnerable to automation. The speed of change means that people need new skills every day and they have to be ready to change if they want to be still on the labour market. Lifelong learning and digita...

Implications of big data for individuals (3)

Image
Healthcare Benefits Big data has completely changed healthcare with its ability to deliver more predictive, preventive, and personalized care. Records of electronic health, fitness trackers wearable, and social media are just some examples of the sources of data, which can be analyzed to identify health trends, monitor disease outbreaks, and drive patient outcomes. In turn, this enables doctors to be able to identify diseases at an early stage and treat them more efficiently. Arguably, the most revolutionary contribution of big data to the healthcare sector is in the field of personalized medicine. If genetic, lifestyle, and environmental data are integrated, medical treatments can be customized for each person. This can not only increase success rate, minimize adverse effects, but also save money in healthcare over a period of time. Big data can definitely be called a blessing for public health. In times of pandemics or epidemics, data analytics enables tracing of the virus spread, p...

Implications of big data for individuals (2)

Image
  Personalization and Conveniences  The most apparent data of big data is the personalized experiences that it allows. Netflix gives you a show recommendation, or Spotify chooses your playlist to Google Maps that can predict traffic. For every user identification, the processing of the past doings and the users' preferences have been made easier being that the platform gets a higher level of identification of the user. Yet, there are also unexpected downsides to this customization. The algorithms used to have users access what they like are the same ones that will ultimately isolate them in the "echo chamber" and not be able to get in touch with different opinion or new material. Consequently, the intellectual diversity of people will drop as they continue to hold on to certain ideas, and this is especially hazardous in the fields of politics or news consumption. Another disadvantage is that behavioural targeting can be quite annoying. The ads show up when they do, lack t...

Historical development of big data.

Image
Historical development of big data.   The big data concept did not begin only with the digital age but was germinated long ago with the challenge of managing the mass of information. In the 1940s – 60s, the data was stored mainly on punch cards and magnetic tapes for government and military purposes. The 1980s gave birth to relational databases such as Oracle and IBM DB2, which provided more structured data management, although the amount of data was still manageable with traditional tools. The surge in the 1990s and 2000s, particularly the rapid growth of the internet, social media, and mobile technologies, marked the commencement of unstructured data generation. The emergence of distributed storage and analysis through many machines by Google MapReduce in 2004 and the launch of Hadoop soon after were the turning points of data processing. The 2010s also brought about the cloud computing, the NoSQL databases, and the real-time processing platforms such as Apache Spark which ma...

Contemporary applications of big data in society

Image
AccuWeather on Microsoft Azure AccuWeather is known as one of the weather forecast data providers that have been around the longest and are also highly regarded. The company offers an API that can be embedded into the systems of other companies, thus giving the user an opportunity to display her weather content to others. AccuWeather intended to transfer their data processing entirely to the cloud whereas most data management platforms were not capable of supporting the traditional GRIB 2 data format for weather data. However, using Microsoft Azure, Azure Data Lake Storage, and Azure Databricks (AI) services, it was possible for the company to implement a data to be converted from GRIB 2 format to any other the company works with, data to be deeper analyzed than before and data to be stored in an easily scalable way. Besides this, Azure, the solution, made it possible for the data to be converted from GRIB 2 format to any other, the data to be analyzed more in-depth, and the data to be...

Contemporary applications of big data in science

Image
  Etsy on Google Cloud Etsy is a platform for craftsmen, designers, and vintage sellers to showcase their work to the public. In the pursuit of creating a marketplace that is based on a community of customers and sellers, Etsy had the idea of migrating their platform to the cloud to improve it, keeping in pace with the necessary innovations. However, the company also sought to retain the personal and values' touch that characterized its customer base. In a report by Google, Etsy is moving its cloud and big data infrastructure to Google Cloud for three main reasons: Google is well-equipped with such features as scalability, it is the most serious cloud service provider in terms of the environment, and it has a people-first approach to doing business. According to Mike Fisher, CTO at Etsy, the way Google approached the problems was the main factor that made them change their minds and opt for Google. "We experienced that Google will attend the meetings, sit down and agree with u...

Contemporary applications of big data in business (3)

Image
  Coca-Cola Coca-Cola is a beverage magnate that reigns over the world with over 500 soft drink brands sold in over 200 countries. Coca-Cola's extensive network greatly impacts the company's data collection in the value chain i.e. sourcing, production, distribution, sales, and customer feedback which they use for making good decisions in the business. The company is deeply committed to the research and development of artificial intelligence which is targeted at utilizing the collected data from customers all around the world in a more efficient way. This move allowed Coca-Cola to get at the heart of local consumer trends through product prices, flavors, packaging, and the choice of the healthy option in a region. The company has millions of followers on Twitter and Facebook which has made it have masses of social media data. The use of AI technology plus image recognition allows Coca-Cola to give a target to the photos of their drinks that are going online. This information, al...

Contemporary applications of big data in business (2)

Image
  Netflix: Netflix connected 151 million subscribers in a digitized manner. It tracks the data of every consumer and then analyses it to discover customer behaviour and viewing trends. Next, it uses this data to suggest movies and shows that match the subscriber’s mood and tastes. Netflix claims that approximately 80% of the audience comes from personalized algorithmic recommendations. Netflix is ahead of its rivals as, unlike other providers, it gathers a large number of data points to construct a detailed profile of each of its subscribers. Such subscriber profiles, which are richly composed, allow Netflix to reach its audience on several levels. The recommendation system that contributes more than 80% to the consumption of the streaming content allowed Netflix to profit from customer retention to the tune of 1 billion dollars. This has meant that Netflix has not had to invest large sums of money in the advertising or marketing of their shows to the same extent as before. They ha...

Traditional statistics (inferential /Descriptiv )

Image
Case Study Descriptive Statistics Descriptive statistics summarize and describe the features of the dataset illustrated in the table. Dataset Overview: The table provides data of 8 users with the following columns: Followers, Posts, Following, and Likes. Mean (Average) Followers: The average number of followers was 91.09375, that gives an overall idea about the users popularity level. Median Posts: The midpoint of the distribution of the number of the posts is 19.5, this number means that half of the users post more than this value, and the other half post less. Mode of Following: Most frequent value in a "Following" column is 0, which means, practically, users don’t follow anyone the most times (this is the case with Ajmal and Saif). The statistics illustrate the concepts of central tendency and dispersion of the users. For instance, one user (Khalid) has an extremely high number of posts (302), which has a disproportional effect on the dataset. Inferential Statistics Infere...

Future applications of big data (8)

Image
  Climate Change and Environment Big Data is going to aid in the battle against climate change. Researchers can utilize it to monitor modifications in temperature, sea levels, and weather patterns. This in turn allows them to comprehend the situation of the planet and the actions that need to be taken to prevent further harm. Firstly, the satellite data allows the experts to keep an eye on the forests, oceans, and ice caps. This facilitates the detection of problems at an early stage such as illegal logging or the disappearance of the ice. Hence, the steps can be implemented without any delay to save the nature. Big data is another way that can help us rethink energy use and make it more efficient. The smart apparatuses will analyze the power consumption behavior of dwellings and manufacturing units. These will then inform what activities need to be curtailed for energy saving and pollution reduction. This is a win-win situation for humans and the Earth. Going ahead, big data will ...

Future applications of big data (7)

Image
  Smart Cities Big data will definitely have a strong impact on the development of smart cities. A smart city is a city that uses digitized information to make the lives of its inhabitants more comfortable. It is a tremendous help for traffic management, and the use of energy, waste, and water more efficiently. That means greener and safer cities. Smart city traffic lights will be able to harness the power of big data to minimize traffic congestion. Cameras and sensors will continuously gather traffic data and change light timing accordingly. As a result, cars will use less time to go and pollution will be reduced due to no long waits. In a similar vein, the system of garbage collection has the potential to reach a higher level of efficiency. Sensors fitted in trash bins will gather and send waste level information to the city. So it enables workers to empty only those bins, which are not void. Besides that, it gives clean air to the city by consuming less diesel for traversing. On...

Future applications of big data (6)

Image
  Retail and Shopping Using big data, stores and online shops gain a higher degree of customer understanding. They learn what kind of products people prefer, at what time they shop, and how much they typically spend. This allows businesses not only to be more efficient in their customer offering but also to increase their sales. Big data will act as a fuelling engine for store inventories. Like this, they will be informed about the items that are selling well and those that are not. As a result, they don’t run the risk of overstocking the popular items or losing money on those items that are not selling well. Moreover, customers are satisfied because they receive goods when they want and in the amount they want. Personalized online shopping will reach a new level. Big data becomes a tool that enables suggestions of items that are in line with previous behaviors of shopping. Such shopping results in less searching and more enjoyable. One of the benefits is that people are not going ...

Future applications of big data (5)

Image
  Finance and Banking Big data will definitely bring a whole new level of intelligence and safety to banking. Banks definitely can predict customer’s needs more accurately if they can analyze spending habits of people. They can then, further, give customers recommendations regarding saving plans or credit cards that are most applicable to their needs and thus manage the money better. Big data is capable of making fraud a thing of the past as well. The bank may be able to spot any abnormal activity in the account of the individual almost instantly, such as a very large withdrawal that comes out of nowhere. This, in turn, gives them the opportunity to intervene in the fraud before it is all over. Security is given a boost through data. Big data will become the backbone for investors who are looking for market trends. They can work smartly, by going through vast data, to decide the right time for stock buying or selling, hence being more profitable and less risky for their investors. ...

Future applications of big data (4)

Image
  Agriculture Big data will support farmers in producing more food using less energy. Through collecting data from weather, soil, and crops, farmers have the opportunity to identify the optimal timing for planting and harvesting. This leads to more efficient production of healthy crops available on the market and loss prevention. Farmers with data can find out which parts of their property are the ones that require more water or fertilizer. This method is known as precision farming. It is the most resource-efficient way of saving money and protecting the environment by reducing the use of chemicals. At the same time, big data is one of the best tools in forecasting the potential issues like pest infestations or unexpected weather. Early warning gives farmers the possibility of timely intervention and thus crop protection. As a result, food safety will be guaranteed for everyone, along with a stable supply. Big data will also be the medium that links farms with markets in the future...

Future applications of big data (3)

Image
  Transportation Big data will indeed expedite and secure transportation. Municipalities can implement more efficient means to regulate traffic by employing it. By analyzing the flow of traffic, they may not only shrink the length of traffic jams but they can also gain more time in their trips. This in turn leads to relaxation in the stress of the daily commute for the people. Vehicles without drivers will be based on big data. Buses and trains may also operate on improved schedules via the use of passenger count and journey duration data. This, therefore, not only helps cut down on the waiting time but also makes the service more reliable. At the same time, airlines and maritime transport are equally positioned to make good use of the same. The data of many is the oil that runs the shipping industry. Big data is the fuel that powers sustainable success for transport companies.

Future applications of big data (2)

Image
  Education In the upcoming years, the educational system will resort to the analysis of voluminous data to comprehend the students more deeply. The educators have the possibility of tracing the students' learning behaviour, their favourite subjects, and the areas where they might have some learning difficulties. This results in a more customized learning journey. Every student can progress at his or her own speed. In addition, the employment of mass data will be instrumental in the advancement of instructional methods. Schools can determine, which lessons are effective and which ones are not. This supports teachers in perfecting their instructional strategies and at the same time, students receive better academic outcomes and remain motivated to learn. The digital world of e-learning has big data behind it. At times yet to come, intelligent platforms will no longer be automata but will develop into thinking entities. They will provide immediate feedback and will be able to recomme...

Future applications of big data (1)

Image
  HealthCare  Big data has the potential to revolutionize the way healthcare professionals pick up the signs of and treat their patients. By analyzing vast quantities of electronic medical records, doctors are able to identify unexpected correlations of the diseases and thus they can provide more appropriate and rapid care. Besides, it enables them to pinpoint the best medications for each patient. Hospitals will use big data to detect potential illness in people. They can discover, for example, if there are early symptoms of a heart condition. Consequently, physicians will be able to solve the problem before it gets worse. Moreover, it is not only life-saving but also a way to ease the burden of hospitals. Big data also makes it easier for hospital administrators to manage resources effectively. It allows them to see which medical equipment or rooms get the most use. This not only allows the hospital to set up their care services more efficiently but also indirectly ensures a...

Types of visualization (4)

Image
 Histograms Histograms are similar in appearance to bar charts, but their main purpose is to represent data grouped in ranges. Histograms do not represent separate categories; instead, they illustrate the quantities of the elements in each range or interval. They are perfect when one needs to get a quick glimpse of the distribution of numbers. Let us say, a histogram can be the medium to evidence ages of students in a classroom. Each of the bars represents the number of the kids whose age falls within a certain range, such as 10-12 years or 13-15 years. This makes it clear which age range is the most or the least. The histograms are the most widely used statistical tools for visualization and inference in statistical research. They are very helpful in discovering trends in big sets of data. For instance, histogram plotting of customers' purchasing frequency in price brackets may be the appliance of a business endeavour. Obviously, a histogram resembles a bar chart, however, each of...

Types of visualization (3)

Image
  Line Graphs Line graphs connect the dots on a chart with lines. They are primarily used to demonstrate the progress of a certain thing over a period of time. A point represents a number, and the line joining those points shows the trend. Line graphs can be a great option if you want to have a glance if a certain thing has increased or decreased. For instance, a line graph can represent the variation of temperature during a week. The bottom will show the days of the week, and the side will indicate the temperature. The line shows you whether the weather has been warmer or colder through the days that have passed. Moreover, line graphs are excellently applicable if the purpose is to visualize the similarities or differences of two or more datasets. Multiple lines can be plotted in a graph with different colors for each data set. Taking the example of comparing the growth of two plants over a period of a month. That way, you quickly and easily see which one was faster or slower. Lin...

Types of visualization (2)

Image
  Pie Charts  Pie charts are circular charts that are divided into slices. Each slice corresponds to one part of the whole. The area of each slice compares the part in question with the whole. Pie charts are perfect for representing fractions of the whole pie and for understanding how the items are distributed. Pie charts find their way into the surveys and reports mostly. One such instance could be a pie chart sketching the distribution of hours that people spend throughout the day on different activities: sleeping, working, eating, and relaxing. Every segment will represent the amount of time dedicated to each task. The most important thing here is that pie charts are suitable for a limited number of categories. A lot of pieces will turn a pie chart into something confusing to look at. In addition, it is recommended to assign different colors to the slices for making them more visible and easier to comprehend. Pie charts are quite popular in the press and presentation busine...

Types of visualization (1)

Image
  Bar Charts Bar charts are most commonly known for their use of bars to indicate and compare values or quantities. Each bar on the chart corresponds to a category, and the length of the bar indicates the size or value of that category. Bar charts are perfect for comparing things that are next to each other. In the simplest terms, bar charts are the best way to compare different groups. One example is that they can be used to represent the number of students in different classes or the sales of different products. It is just a matter of sight to figure out the largest and the smallest among the groups. Furthermore, you can use different colors to highlight each bar more clearly. A couple of examples of a bar chart's types are simple and stacked bar charts. The former illustrates one group of data, while the latter can represent a total that is divided into parts. Thus, a stacked bar chart can be used to show the distribution of boys and girls in each class. In summary, bar charts a...

Characteristics of big Data (5)

Image
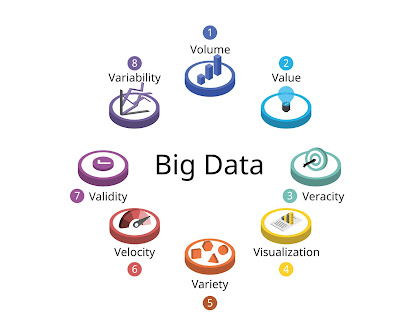
  Value: Making Data Useful The final and most important characteristic is value. After all, what’s the point of having tons of fast, varied, and trustworthy data if it doesn’t help solve real-world problems or improve outcomes? Value is about extracting meaningful insights from data to drive better decisions, save time, reduce costs, or create new opportunities. Creating value from Big Data isn’t just about collecting it—it’s about using the right tools, hiring skilled people, and having clear goals. For example, a retail business might use data to understand which products are most popular, when customers are most likely to buy, and what types of promotions work best. These insights can then be used to boost sales and customer satisfaction. However, not all data automatically has value. Sometimes companies collect too much data without knowing what to do with it, which leads to “data overload.” The key is to focus on collecting relevant data, asking the right questions, and apply...

Characteristics of big Data (4)

Image
  Veracity: Trusting the Data  Veracity is quite concerned with the trustworthiness and nature of the information provided. Nevertheless, the data is only reliable if it comes from a single source and is considered trustworthy not multiple sources or public platforms. Low-quality data in the form of inaccuracies, obsolescence, repetition of mistakes, or bias can swiftly result in the wrong understanding of the situation. Therefore, it is very necessary to fully understand the data source, and how purified or regularly checked the data is to be able to trust it. As an example, let's take prediction analytics in a hospital that can be used to give the best treatment for a patient. If the data is going to have wrong patient records or information which is not updated from test results, the model could suggest dangerous or useless options. The same is true for a marketing case: Using information that is unreliable for your market research will lead to wrong audience targeting whic...

Characteristics of big Data (3)

Image
  Varity: Different Types of Data  One of the main aspects of Big Data is its variety that means the multiple kinds of data that are generated and collected. Traditional data usually comes in some structured formats such as tables and spreadsheets but Big Data encompasses structured, semi-structured and unstructured data. So, for example, texts, audio, pictures, movie, emails, GPS signals, PDF, and many other forms can be considered as the sources of data. This variance is the force that fills Big Data with the life of perception and understanding. It is such an advantage that enables people to recognize their operations and their customers’ behaviour pattern not only through a data-oriented approach but also the real-world one. Let’s say, a company gathers not only sales records but also social media posts, customer reviews, and support chat logs to understand customer satisfaction better. In contrast, on the one hand, the abundance of different types of data becomes a source...

Characteristics of big Data (2)

Image
  Velocity: The Speed of data Flow  Velocity refers to the speed at which data is generated, shared, and processed. In the digital world, information is perpetually on the move—imagine live videos, real-time stock market changes, or even GPS tracking from your phone. The quicker you can gather and analyze this data, the more valuable it becomes. Organizations are routinely faced with a situation where they have to act quickly, based on the data that is flowing rapidly. Let us take as an example, the online retailer who is changing the prices or the recommendations all the time depending on the real-time of what the users are clicking on. This means that the Big Data systems have to be capable of instantaneous processing and response to the data. Technologies such as real-time analytics, streaming platforms, and artificial intelligence are the ones which manage the speed and help. If the velocity is not handled properly then the data may be outdated even before it could be used...

Characteristics of big Data (1)

Image
  Volume: The Massive Amount of Data Volume is a term that generally characterizes the amount of data generated by different sources every single second. Social media posts, online shopping, sensor data, and financial transactions all contribute to the information produced by the world today which is huge in size—sometimes it is measured in terabytes or petabytes. Having more data at hand gives a business the possibility of discovering additional insights. But, on the other hand, managing such large amounts presents a lot of difficulties. This necessitates the presence of reliable storage devices and processing resources which are safe from any troubles while working with this data. Classic computers are often insufficient for such tasks. Therefore, it is quite natural for the companies to employ the means of storage like the cloud, Hadoop, or data lakes for this purpose. Simply put, Volume is the most significant and the most visible characteristic of Big Data—it is not only big, ...

Limitations of Predative analytics (8)

Image
  Legal and Privacy Concerns  Predictive analytics mostly taps into the personal data of individuals, including their shopping habits, locations, ages or even their medical records. This not only allows companies to make their decisions more efficient, but at the same time it seriously endangers people’s legal rights and their privacy. People are concerned about what kind of data has been collected from them, if it is protected, and if it is used only for the purposes they have agreed to. Many countries have very strict legislations governing the collection and utilization of personal information. A good instance is the GDPR in Europe and similar regulations for other parts of the world which allow entities to use data only in cases that have been explicitly stated by the data owner. Besides that, companies have to make known exactly the purpose of using the data and how they will keep it safe. Thus, if an enterprise uses the information in a wrong way or loses it, they can be...

Limitations of Predative analytics (7)

Image
  High Costs and technical Expertise Required  Predictive analytics can be a great tool, but it can be costly at the same time. A system installation demands a lot of resources such as sophisticated software, fast computers, and a huge amount of data storage space. The small or medium-sized business sector is usually not able to afford these tools which can make it difficult for them to get started At the same time, predictive analytics also necessitates a skill set of a highly-qualified staff like data scientists, analysts, and programmers. These experts are able to accomplish the task of data collection, model building, and result interpretation. Nevertheless, engaging professionals with certain skills may cost you a lot and the availability of the experienced ones is usually limited. The job is not done once the system is installed and functioning. Continuously checking, evaluating, and changing models is necessary for them to be correct. This means spending more time and ...

Limitations of Predative analytics (6)

Image
     Dependence On human Interpretation   The Role of Human Interpretation in Predictive Analytics In spite of the employment of complicated algorithms and huge data sets, human reasoning is still required for predictive analytics to become indispensable. The figures provided by the model are often just quantities or probabilities that have to be understood in a practical situation. This is the point where human experience and understanding enter. Computers can detect patterns, but they lack the capacity to comprehend ethics, human feelings, or business objectives. An instance, a model could imply cost-cutting by laying off employees, but a human manager could provide evidence that this would be the case only if it were necessary to ensure that the team morale or customer service were not affected. Besides this, humans take into account factors that the model might not consider, such as possible market trends, local events etc. One of the hazards is that when ...